The multiCM builds on top of the cleverMachine algorithm, part of the cleverSuite. Details of the internal workings and operation can be found in cleverMachine's documentation . Each of the individual models built is indeed a cleverMachine submission in its own regard, and can be used also outside of the multiCM realm.
The aim of the multiCM is to simplify analysis where multiple datasets are at play, and allow simple simultaneous comparison of multiple datasets.
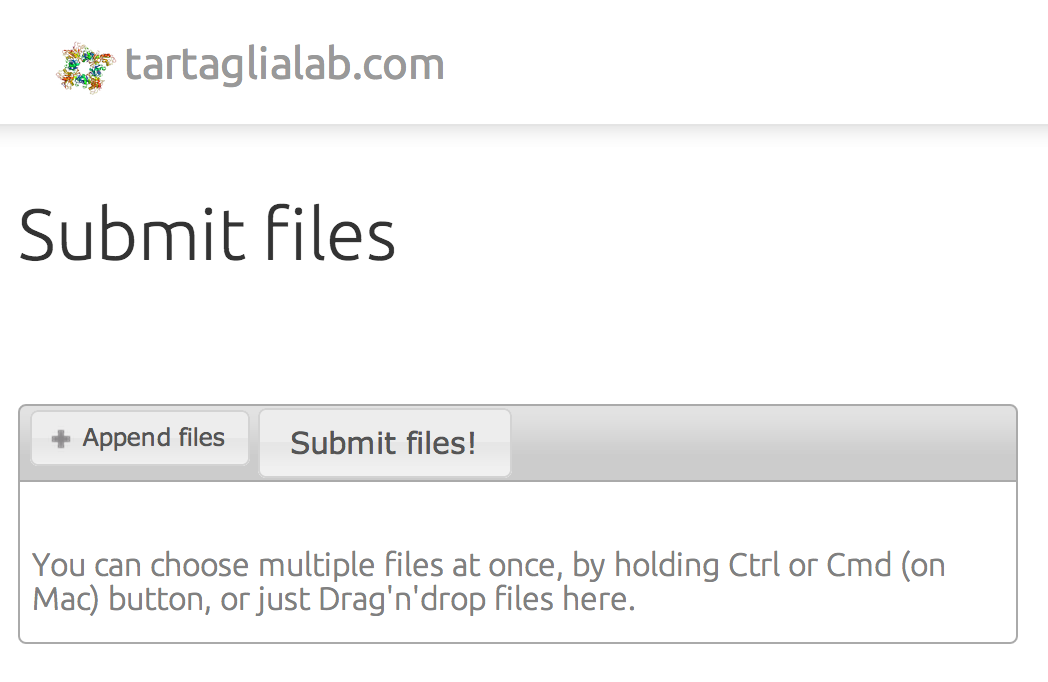
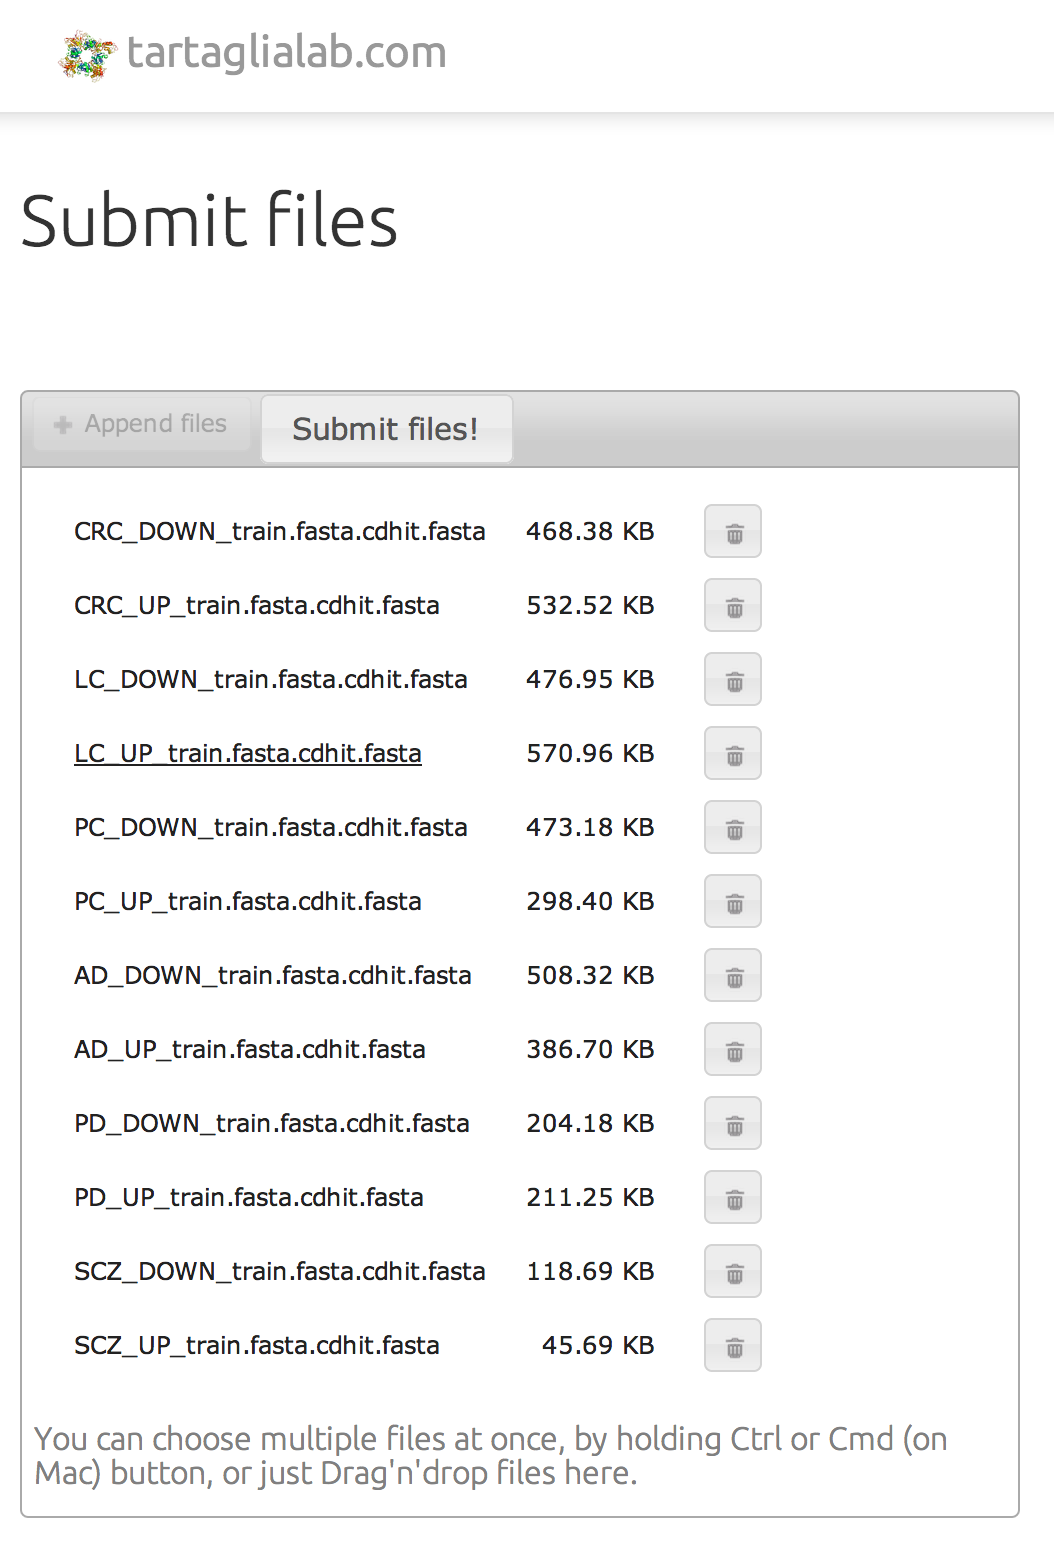
As does the cleverSuite, our tool works on FASTA-formatted files containing protein sequence. The first step is to upload all of the datasets together.
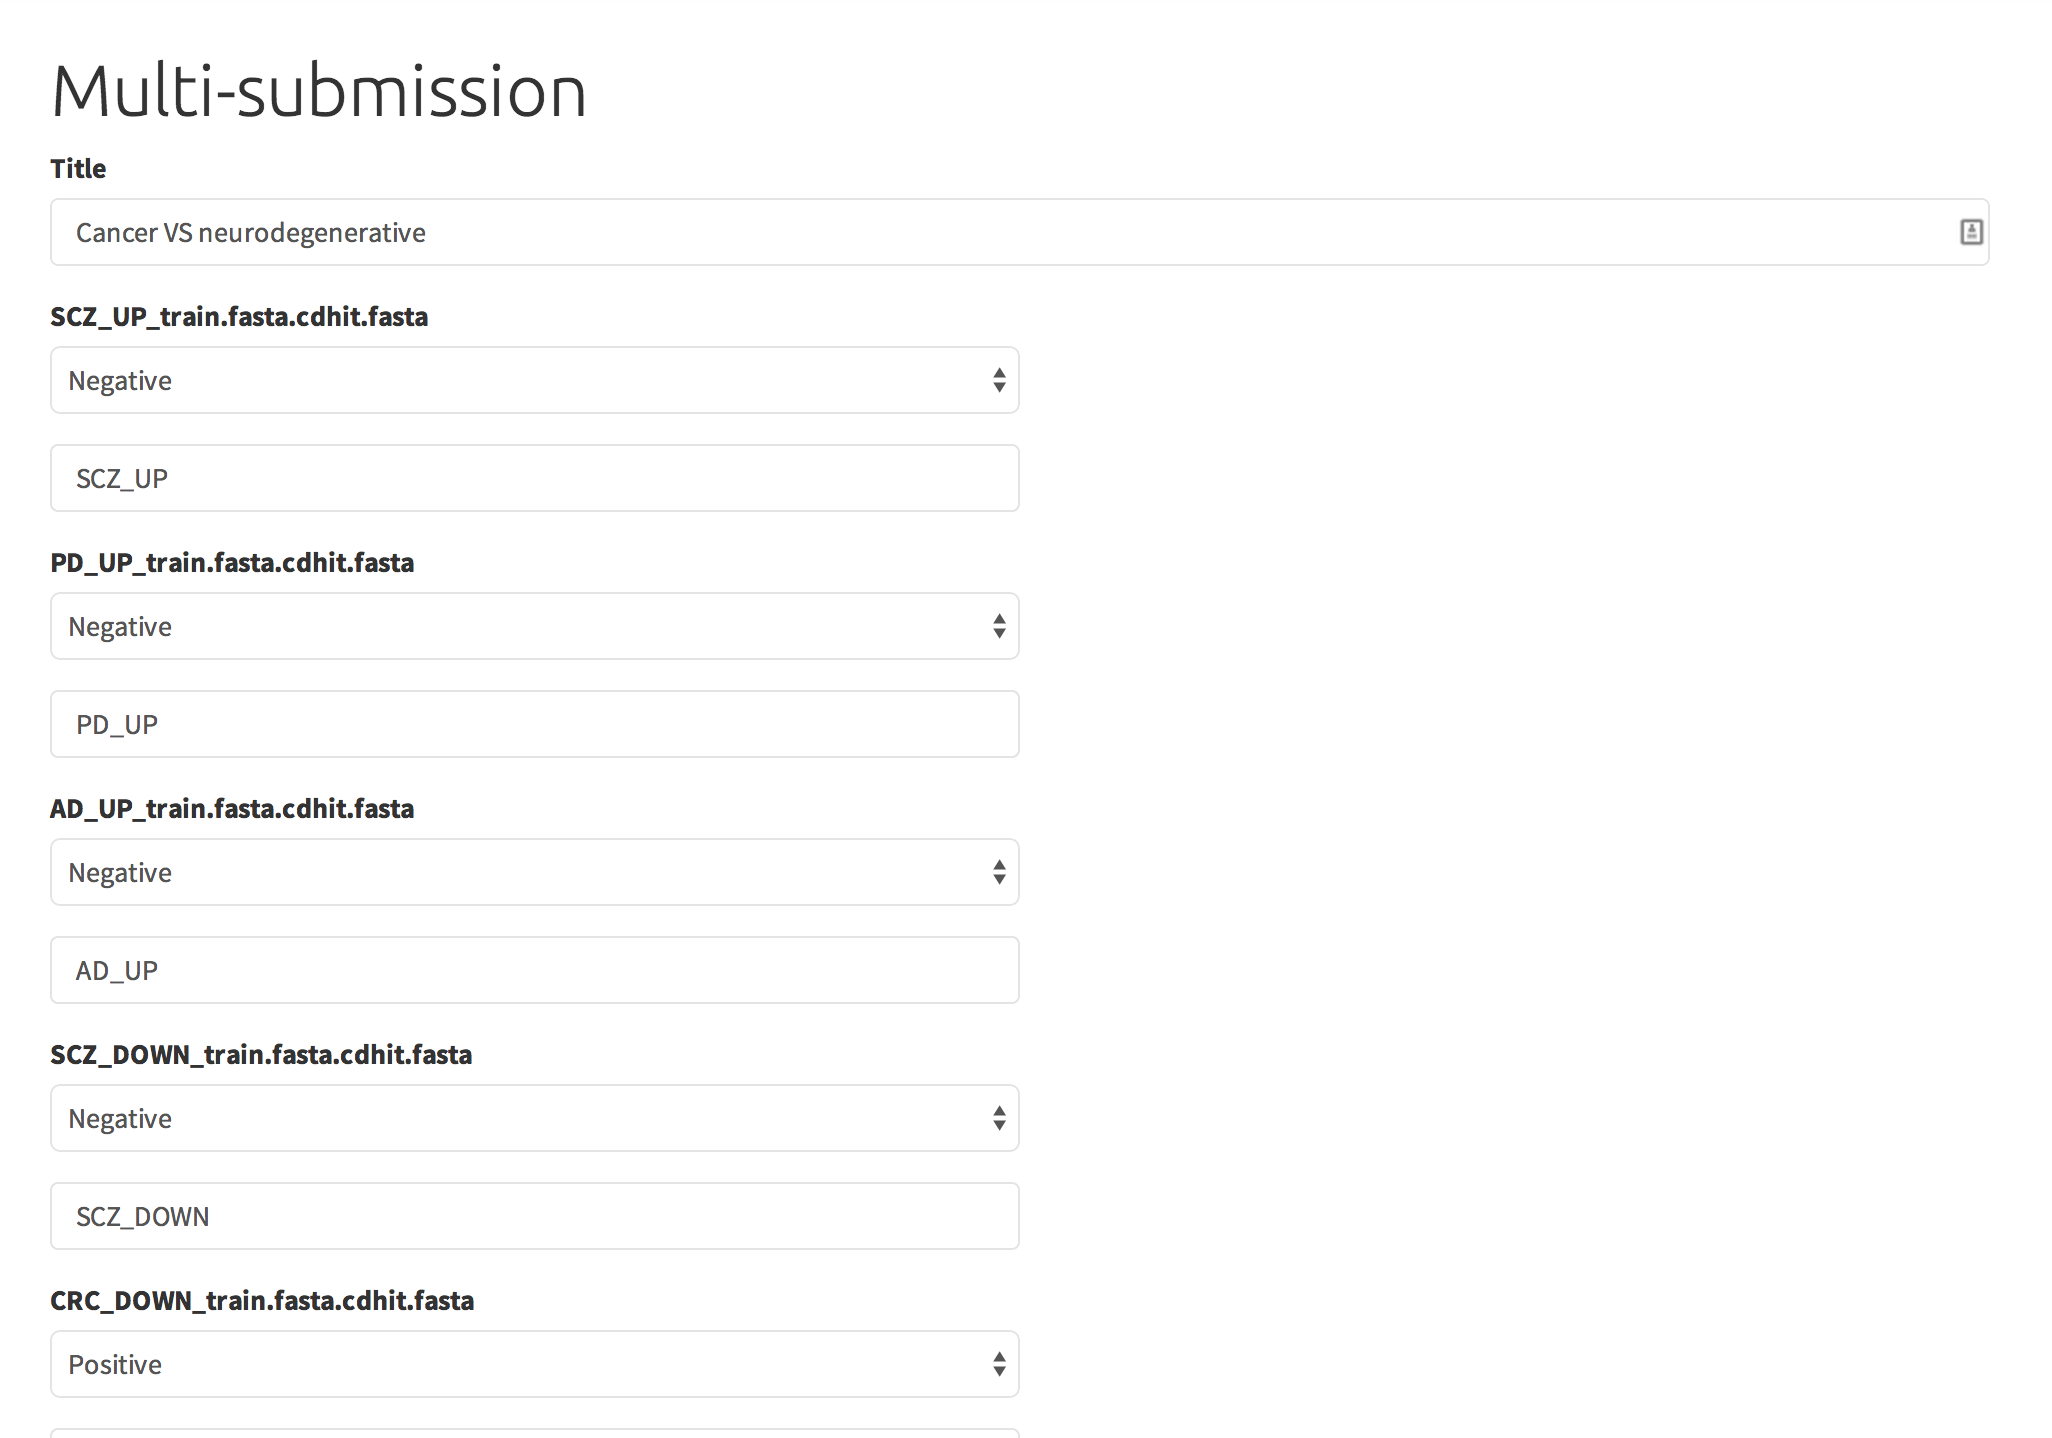
After uploading all the files, they need to be assigned to positive/negative datasets. This determines how are the datasets grouped together for cleverMachine model analyses.
However, the positive/negative denomination does not influence the algorithm in any way - all we do is to separate the input into two groups. As you can see below, each dataset can be also assigned a nice title, if not, filename is used. Also, the overall submission needs to be given a title.
The second step also allows users to enter email address for notification when calculation is finished.
After all of the datasets are assigned to be either positive/negative, the last step before the calculation commences is a overview of the submission data:
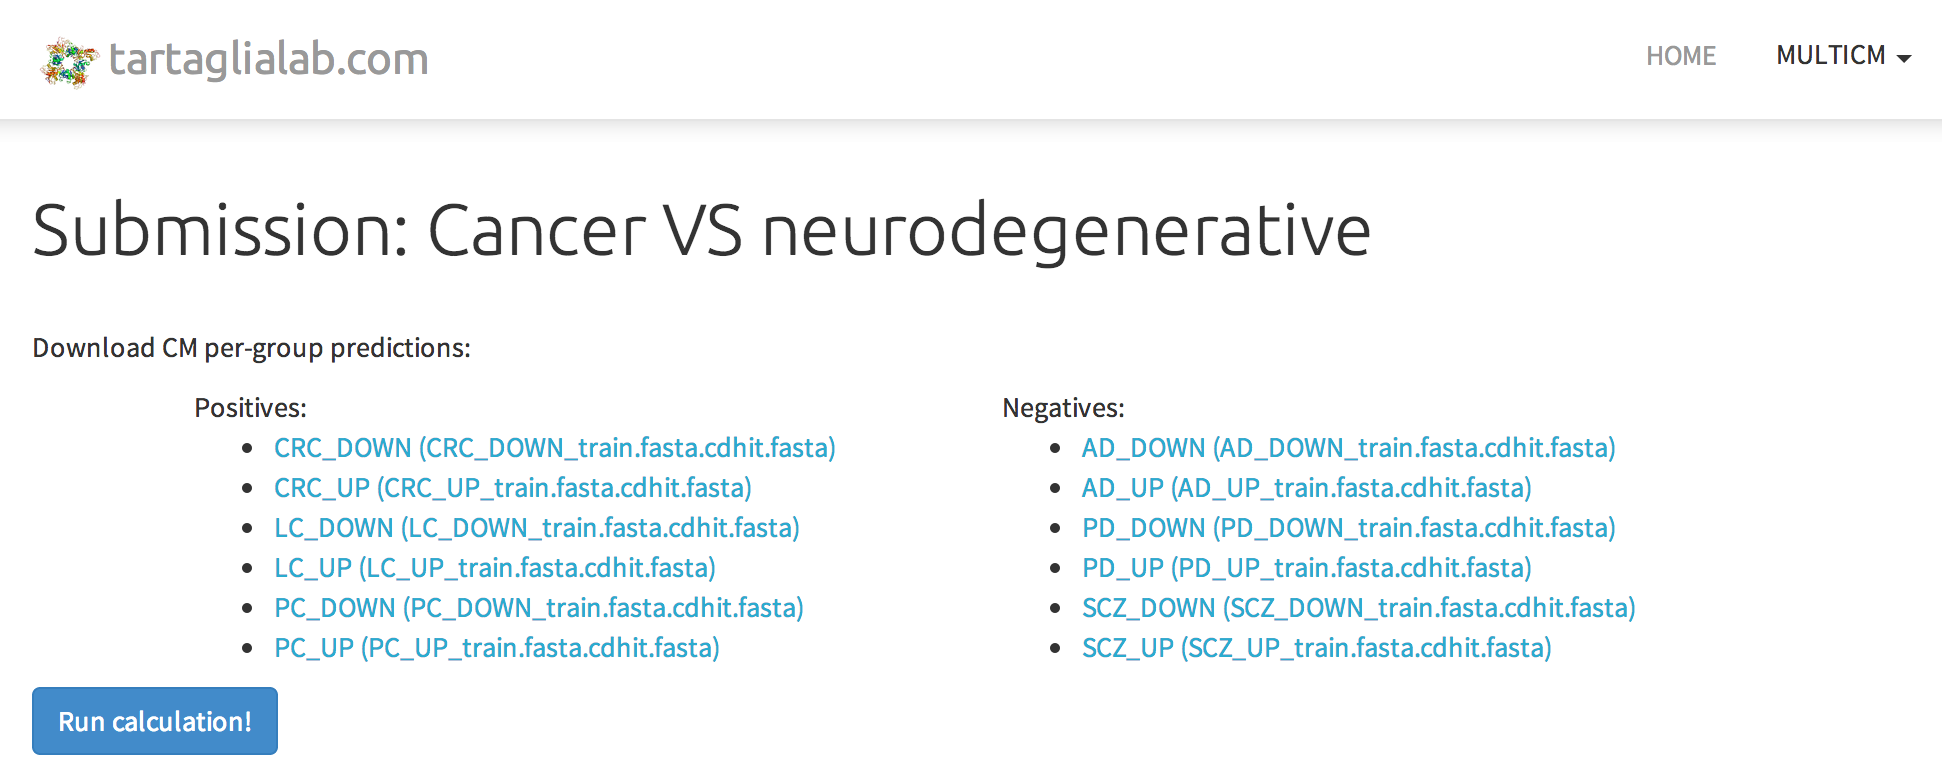
If all seems correct, calculation can be executed by pressing the "Run calculation" button. Do not worry if there is seemingly no response - the webserver submits all possible combinations of positive/negative sets while you wait. No need to wait until the page refreshes - feel free to grap a cup of coffee - just make a note of the URL you are on - you will need it to return to the submission and check on the calculation progress.
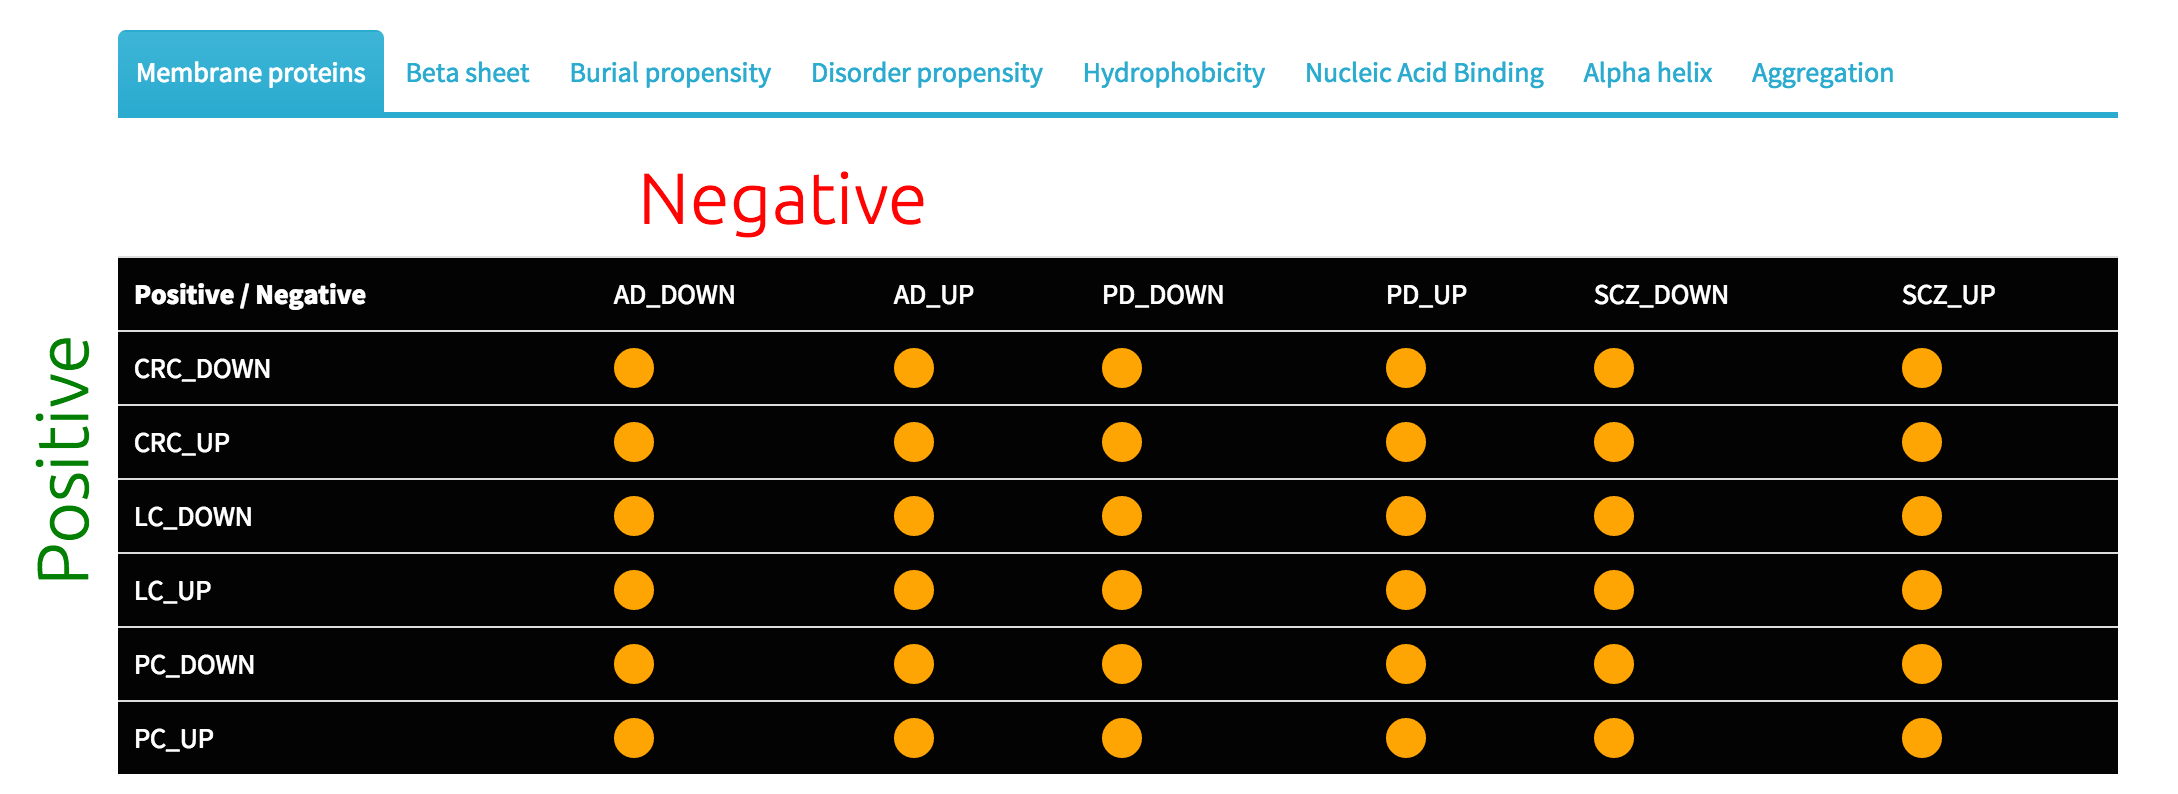
During processing of user data, the first view serves as a calculation grid, providing at-a-glance representation of the calculation progress. The legend above the image explains what is the state of the individual combination of the positive/negative dataset.
Each of the cells represents a single cleverMachine model. Indeed, each cell serves as a link to a detail view (see below). Also, on the mouse-over of the individual cell, user can see the cross-validation accuracy of the CM model.
The status of the calculation is refreshed automatically behind the scenes, however, the user need to re-load the page to see the progress.
On average, comparing two files containing 1000 sequences each would take 20 minutes, which sums up to 12 hours for 6x6 matrix. The calculation time does vary, as we are using shared computing infrastructure. For more details, see appendix below.
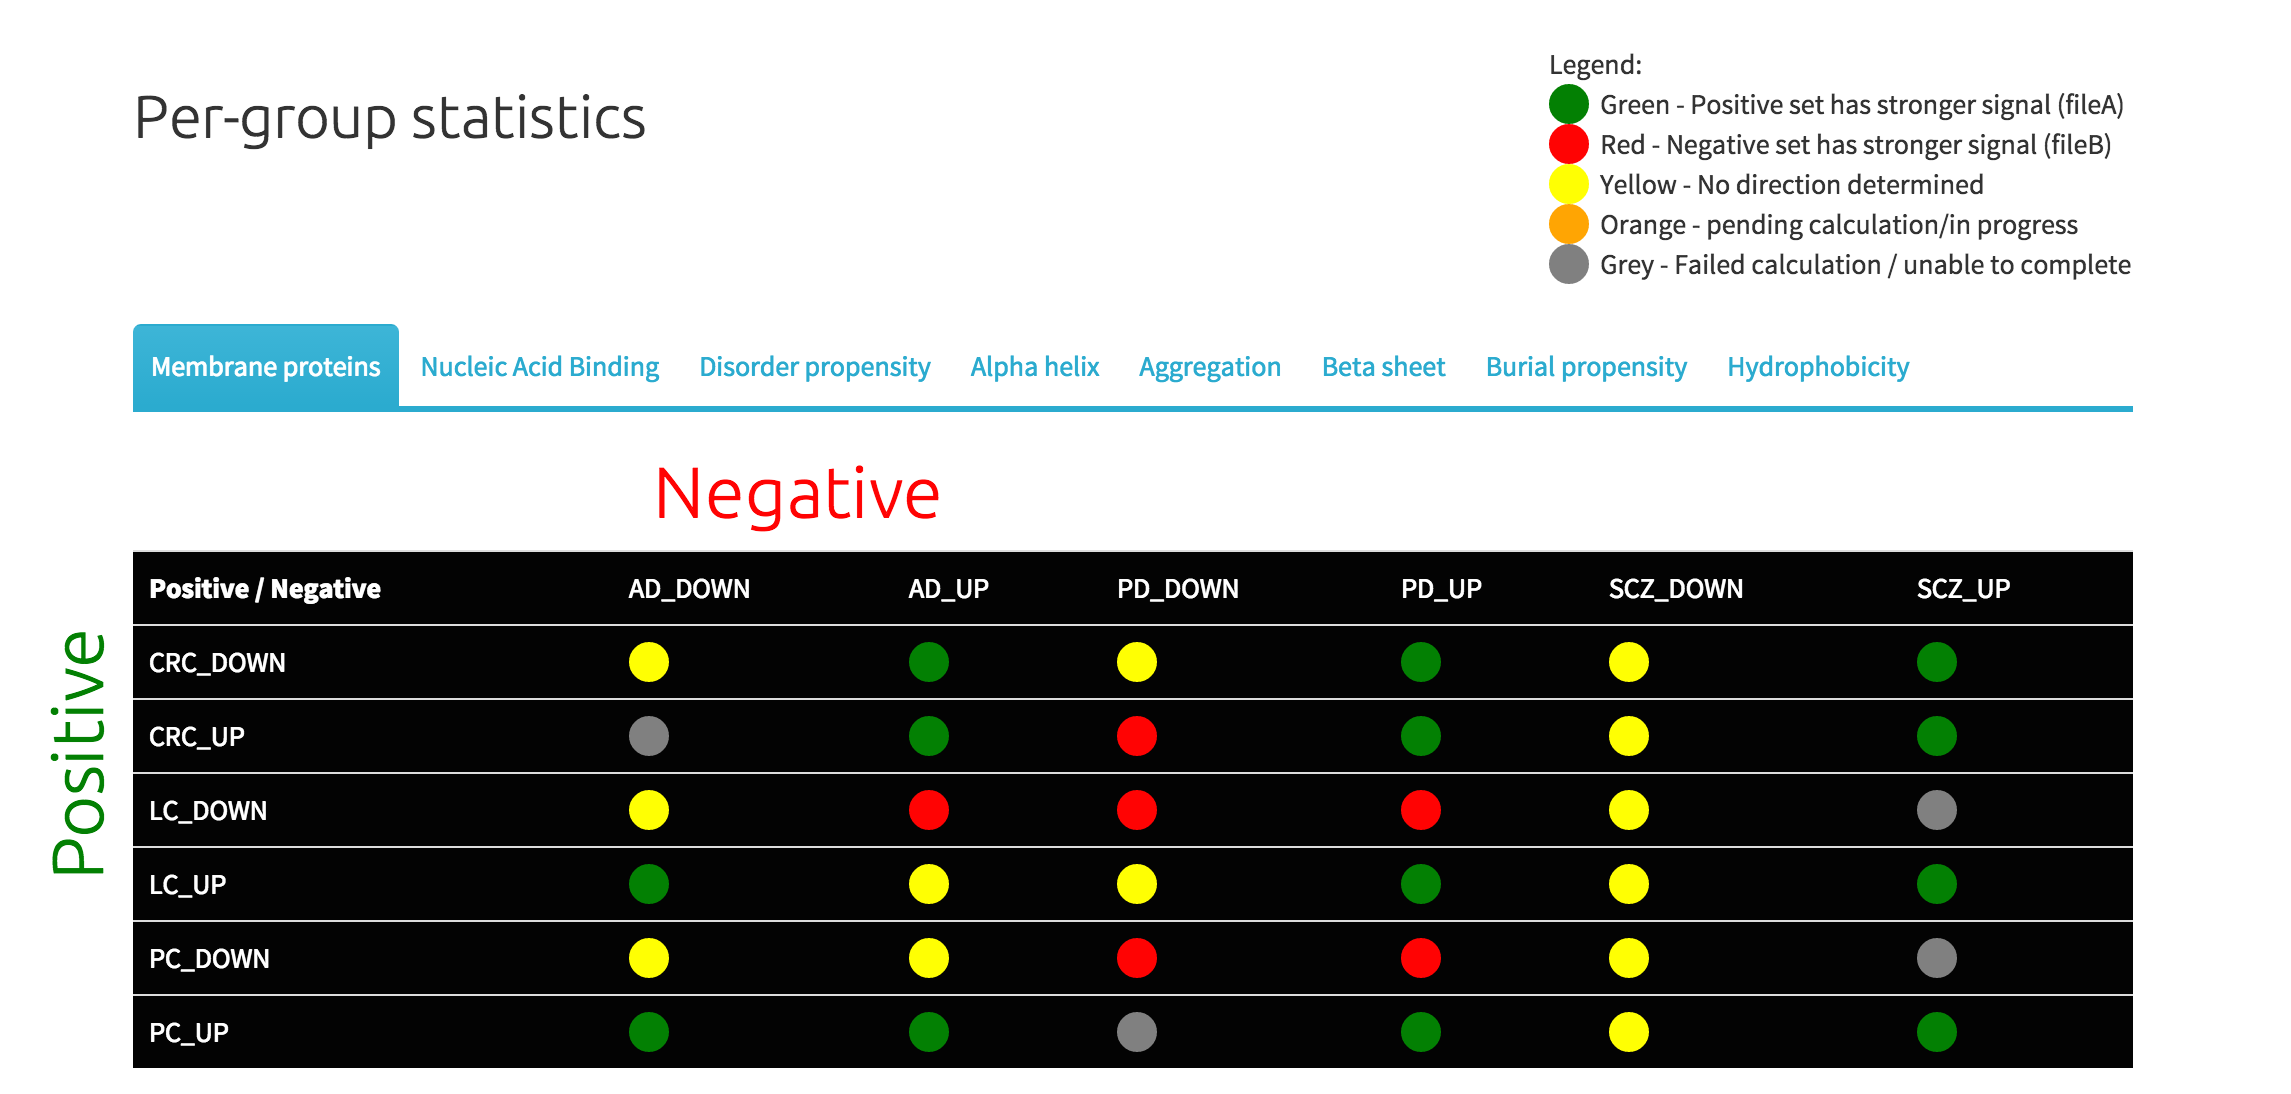
The per-group view provides signal strength and orientation for each of the models. As the legend explains, green colour signifies stronger signal in the positive dataset (row), red colour means that the signal was stronger in the negative set (column). If the signal strength is equal, yellow colour is shown. Grey colour signifies that the model could not be created, thus answer for the cell does not exist.
Furthermore, there is additional piece of information available when the user mouse-overs the cell. The number reported signifies the strengh and detected direction of the signal.
Same as the calculation grid, click-through shows detail view.
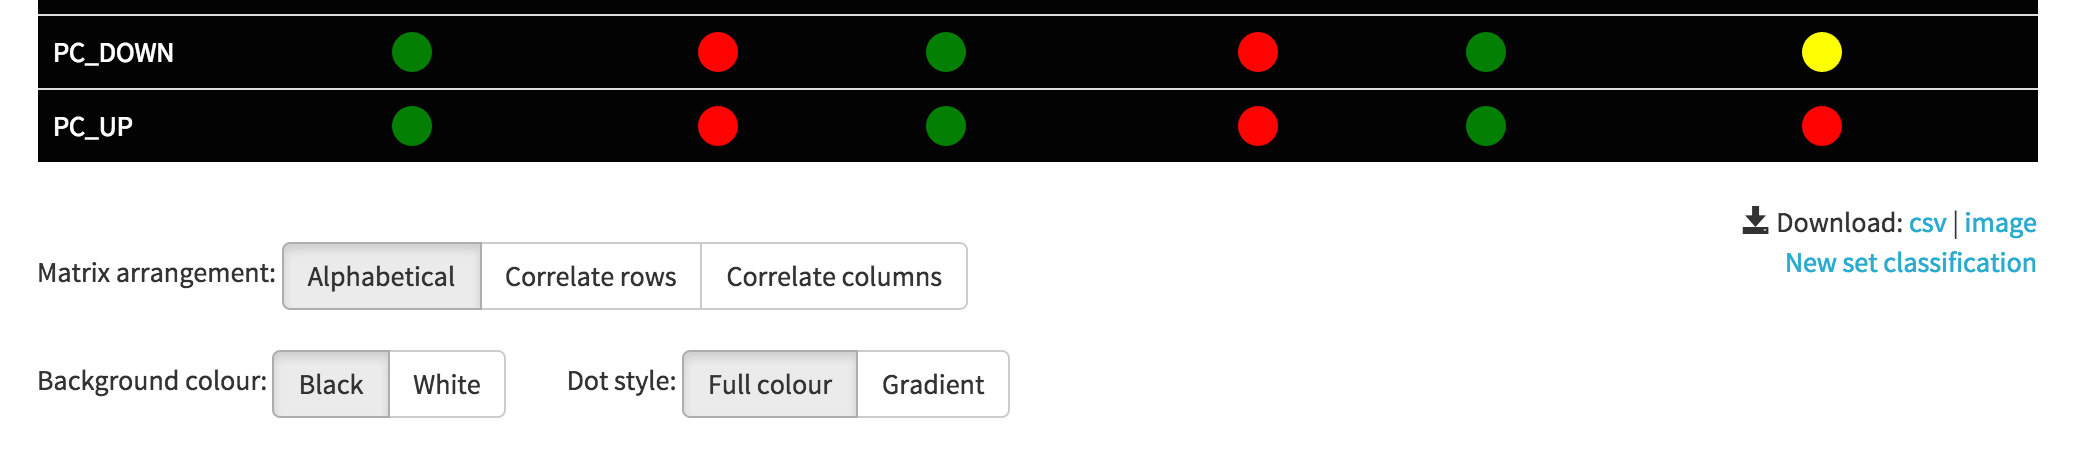
The enrichment matrix can be re-arranged according to the user's preference. The default option is a view sorted by the name of the sets. However, there is also an option to re-arrange the matrix to maximise either row or column similarity. The background colour can also be changed between black and white. Lastly, the "dots" can be switched to gradient colour scheme, indicating enrichment strengh via saturation of the colour.
The current view of the table can be saved as an image, as well as a textual form in a CSV format. When all of the calculations are ready, it is also possible to use multiCleverClassifier to submit futher sets and evaluate them against the models.
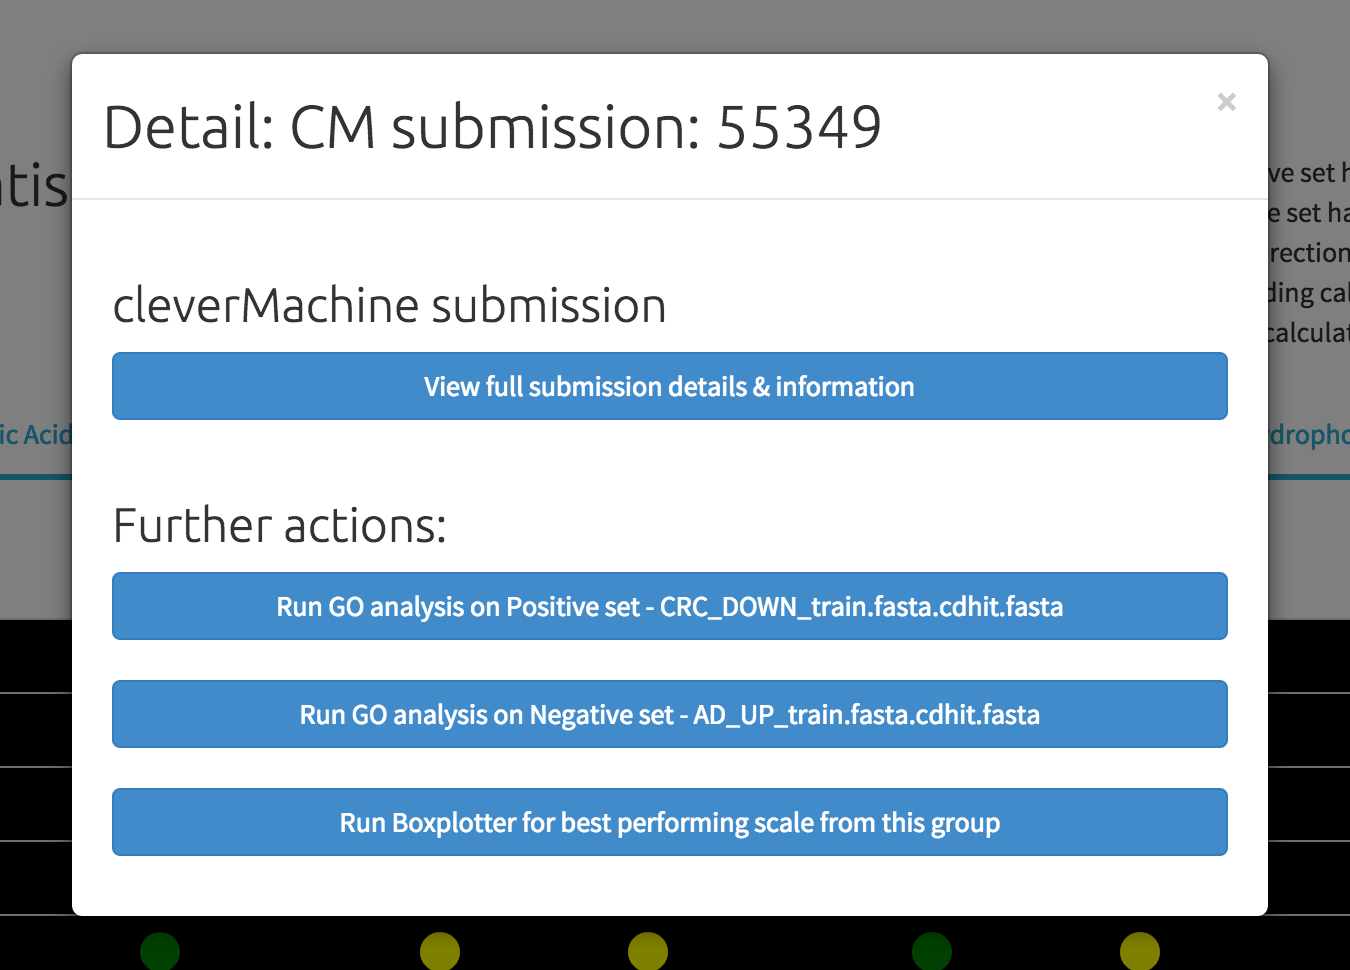
The detail view is activated by clicking on any of the cells in the table. The first link leads to the full cleverMachine submission information, and the other 2 links present shortcuts to run our GO analysis. The GO analyser is capable of extracting the ID labels from fasta files and allows for a single-click analysis submission.
The last button on the list runs the "Boxplotter" tool, which can be used to evaluate the best performing scale for the group under investigation and compare value distribution between the curren positive and negative sets.
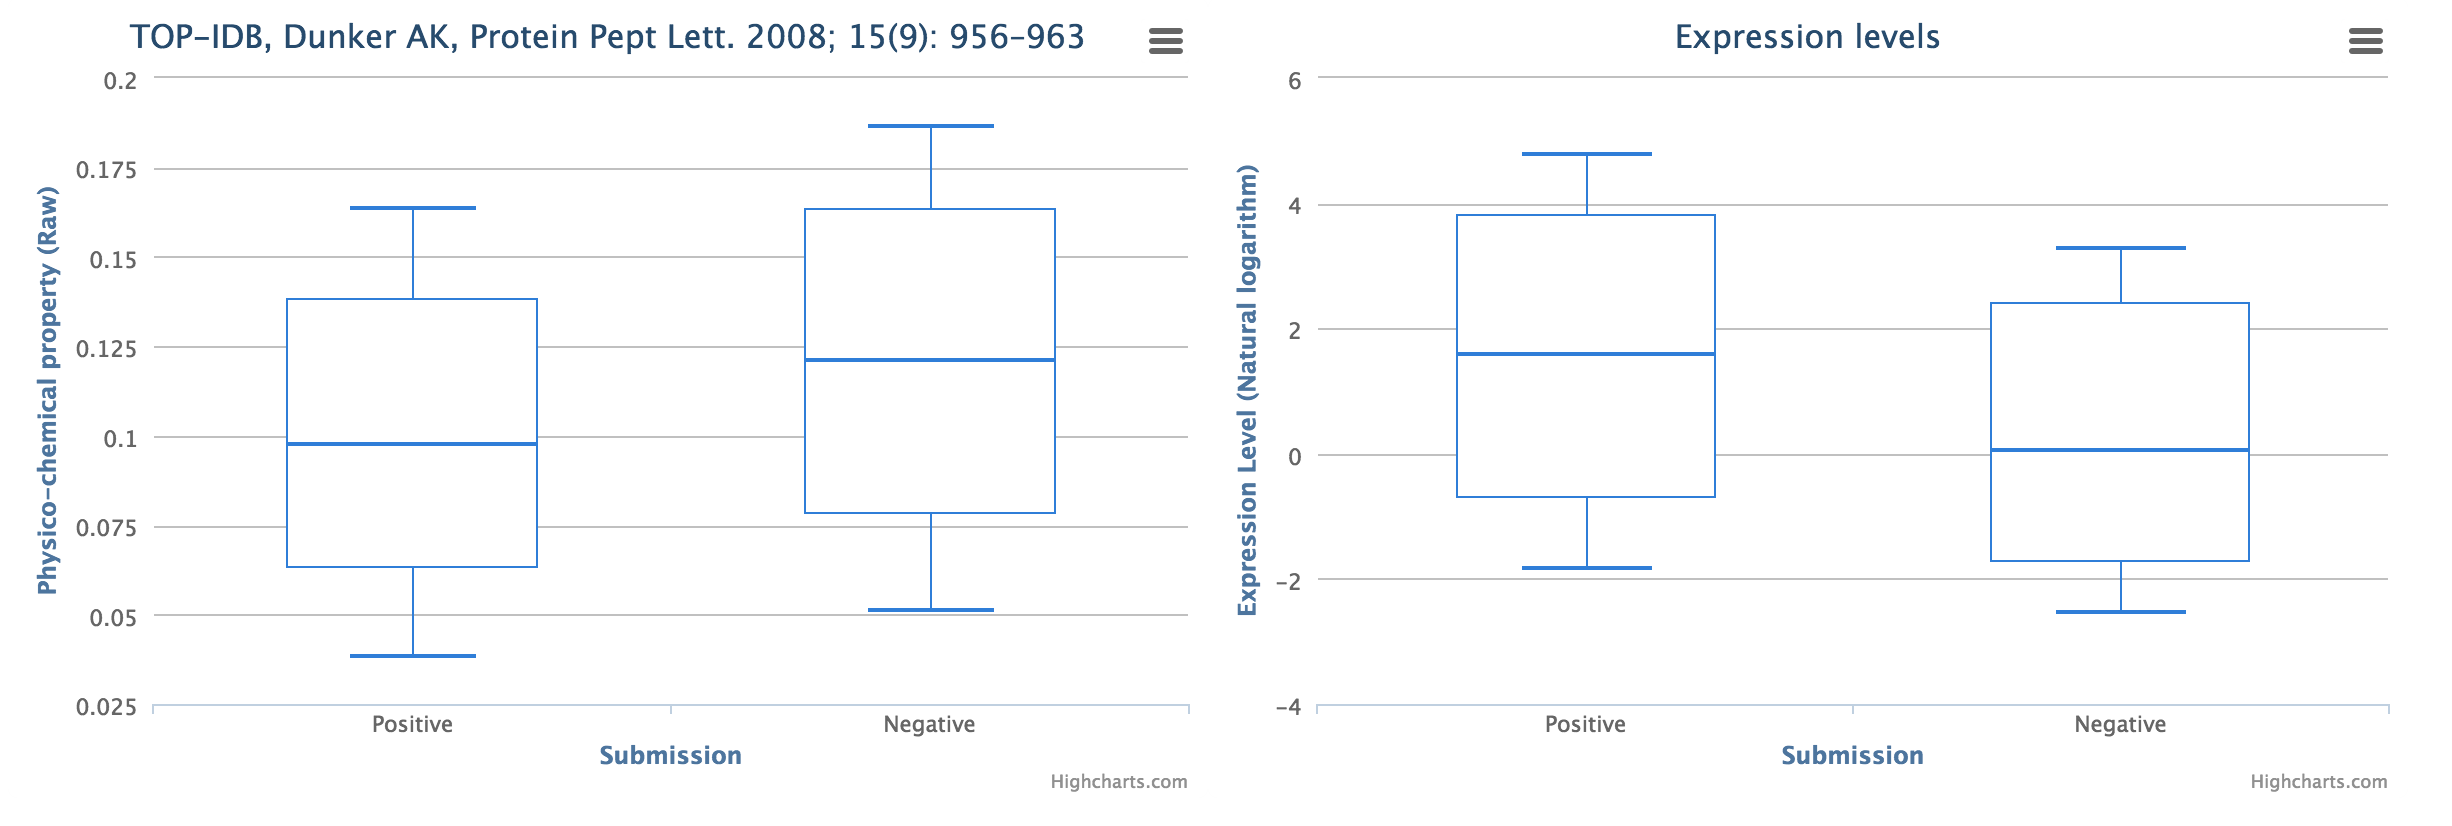
Apart from calculating the scale value distribution, there is also an option to calculate expression levels for each of the sets. The expression information was downloaded from PaxDB.
The expression calculation option relies on the extraction of product identifiers from the sequence labels to match them with a database.

The scale consensus/information strenght information can be seen by hovering the mouse cursor over each of the coloured dots. The first number signifies enrichment; a negative number means enrichment on set negative set (red dot) and a positive number means that there is enrichment on positive set (green dot). The absolute value of the first number (-3) means number of predictors that were used to derive the conclusion (at the moment of writing, our database contains 10 predictors for each feature group). The second number signifies the overall best scale (internal index). The third number (0.91) signifies cross-validation strength of the model built. Last piece of information is a short-hand for the model that achieved said accuracy. For more details, please see cleverMachine documentation.
As it is the case for the base algorithm of the multiCM, the cleverMachine, there assignment of sets to positive and negative groups is purely to distinguish them as two groups - there is no processing bias to either of the groups. To help interpret the multiCM output, we have created an interpretation diagram. for your convenience.
The datasets used as multiCM examples were extracted from the following publication:
Ibáñez K, Boullosa C, Tabarés-Seisdedos R, Baudot A, Valencia A (2014) Molecular Evidence for the Inverse Comorbidity between Central Nervous System Disorders and Cancers Detected by Transcriptomic Meta-analyses. PLoS Genet 10(2): e1004173. doi:10.1371/journal.pgen.1004173The pre-calculated preview is using a 10% sampling of the datasets for performance reasons.
We ensure that our algorithm works on latest versions of Mozilla Firefox and Google Chrome. We are relying on the latest and greatest of web technologies and we do not require any extra plugin installation.
As a consequence of the above, any other browser not mentioned above is not supported and may not provide full experience.
Also, should you experience any problems when uploading files, please ensure that your internet connection works properly and there are no proxies/firewalls blocking the transfer in between you and our servers.
We compiled a few sample jobs to estimate the time required for each individual submission:
| set A size | set B size | calculation time (hours) | link |
|---|---|---|---|
| 661 | 32 | 0.25 | link |
| 3000 | 87 | 0.75 | link |
| 87 | 680 | 1 | link |
| 7500 | 4500 | 20 | link |
| 7500 | 8700 | 24 | link |
| 7500 | 3200 | 24 | link |
| 10000 | 4500 | 28 | link |
We ensure that our algorithm works on latest versions of Mozilla Firefox and Google Chrome. We are relying on the latest and greatest of web technologies and we do not require any extra plugin installation.
As a consequence of the above, any other browser not mentioned above is not supported and may not provide full experience.
Also, should you experience any problems when uploading files, please ensure that your internet connection works properly and there are no proxies/firewalls blocking the transfer in between you and our servers.
We compiled a few sample multiCM jobs to estimate the time required for each complete submission:
| Set name | Comment | Link |
|---|---|---|
| Protein aggregation and longevity | completed within 1 hour due to low amount of signal present | link |
| Cancer vs Neurodegeneration reduced example | small subset to try out multiCM, completed in 3 hours | link |
| Physico-chemical determinants of protein insolubility | complete in 4 hours | link |
| Chaperone interactors | smaller dataset, estimated completion within 6 hours | link |
| Cancer vs Neurodegeneration FULL | large set used to generate the full-fledged example, completed in 4.5 days | link |